01
Anomalous light curves
Search for asymmetric dips, evolving transit shapes, structured occultations, strange duty cycles, and quasi-periodic dimming in Kepler, K2, TESS, and ground-based photometry.
Enter the MegaMiner labTechnosignatures in existing data
AI-based searches for technosignatures in public archival exoplanet datasets. The website documents ongoing progress and identifies future directions for mining existing Kepler, K2, TESS, and high-resolution spectroscopic archives to place observational constraints on the prevalence of technologically advanced extraterrestrial life.
Analysis progress
With generous support from John Davie, we have developed an AI-enabled MegaMiner pipeline that is now searching millions of TESS threshold-crossing events (TCEs) for anomalous transit morphologies.
Two search frontiers
TechnoSurveys.com focuses on two technosignature classes that can be investigated with existing archival exoplanet data: anomalous photometric light curves and narrow laser-like spectral features. Both classes are tied to measurable observables, reproducible archive products, and follow-up tests that can separate astrophysical, instrumental, and artificial hypotheses.
Search for asymmetric dips, evolving transit shapes, structured occultations, strange duty cycles, and quasi-periodic dimming in Kepler, K2, TESS, and ground-based photometry.
Enter the MegaMiner labReuse high-resolution spectra as accidental laser-monitoring programs. The target is not a published radial velocity, but unresolved emission-like spikes in the underlying spectra.
Inspect spectral archivesThe scale of the searchable archive
Public photometric surveys already contain billions of effective star-hours. These two views connect that archive scale to the populations of 3%-dimming structures that can be investigated, using transparent survey-level assumptions and reproducible source tables.
Cumulative effective integration, summed over every monitored star from 2009 through 2025.
Effective exposure counts actual photometric integration, not elapsed survey duration. Survey overlap is retained because the quantity is total available exposure rather than unique sky coverage.
Captured stellar power is used as an engineering scale; lower curves indicate sensitivity to rarer populations.
The plotted quantity is a one-object reach metric, eta = 1/N in each 0.25-dex power bin. It is not a formal confidence interval or a catalog-derived population constraint.
Figure 1 derivation
Continuous space photometry uses the monitored-star count multiplied by annual wall-clock hours and a duty factor. Sparse ground surveys count only the summed exposure time of visits. Contributions are accumulated independently and then added by calendar year.
| Survey | Interval | Adopted exposure prescription |
|---|---|---|
| Kepler prime | 2009-2013 | 150,000 stars, 0.92 duty; partial-year factors of 0.58 in 2009 and 0.38 in 2013. |
| K2 | 2014-2018 | 500,000 target light curves, 75 days each, 0.85 duty, distributed across the five observing years. |
| ASAS-SN | 2013-2025 | 50 million stars, 75 visits per year, 270 seconds per visit; 0.25 ramp factor in 2013. |
| TESS | 2018-2025 | 13 sectors per year, 27.4 days per sector, 0.90 duty; adopted target counts evolve from 15,000 to 10,000 per sector. |
| ZTF | 2018-2025 | 500 million stellar sources, 50 visits per year, 30 seconds per visit; 0.75 ramp factor in 2018. |
This is a conservative, literature-informed survey model rather than an exposure-ledger reconstruction. TESS full-frame-image light curves are excluded, and ASAS-SN and ZTF dominate the uncertainty.
Download Figure 1 source tableFigure 2 derivation
Each survey is represented by one million Monte Carlo stellar luminosities drawn from survey-specific Gaussian mixtures and scaled to the adopted archive population. Luminosities are converted to the power corresponding to 3% of the host star, then counted in 60 equal logarithmic bins from 1016 to 1031 W.
Bins with fewer than 10 expected stars are omitted. Kardashev Type I and II reference powers are marked at 1016 and 1026 W. A reach of 10-6 means approximately one million modeled stars occupy that power bin.
The luminosity distributions are synthetic, not catalog cross-matches. The 3% mapping does not specify geometry or collector area, and eta = 1/N is a reach metric. A zero-detection 95% upper limit would instead require approximately 3/[Nstar epsilon(P)], including injection-recovery completeness.
Download Figure 2 source tablePublic datasets to mine
The initial search is built around public, data-rich facilities that already contain the relevant observables: precise time-series photometry and high-resolution stellar spectra.
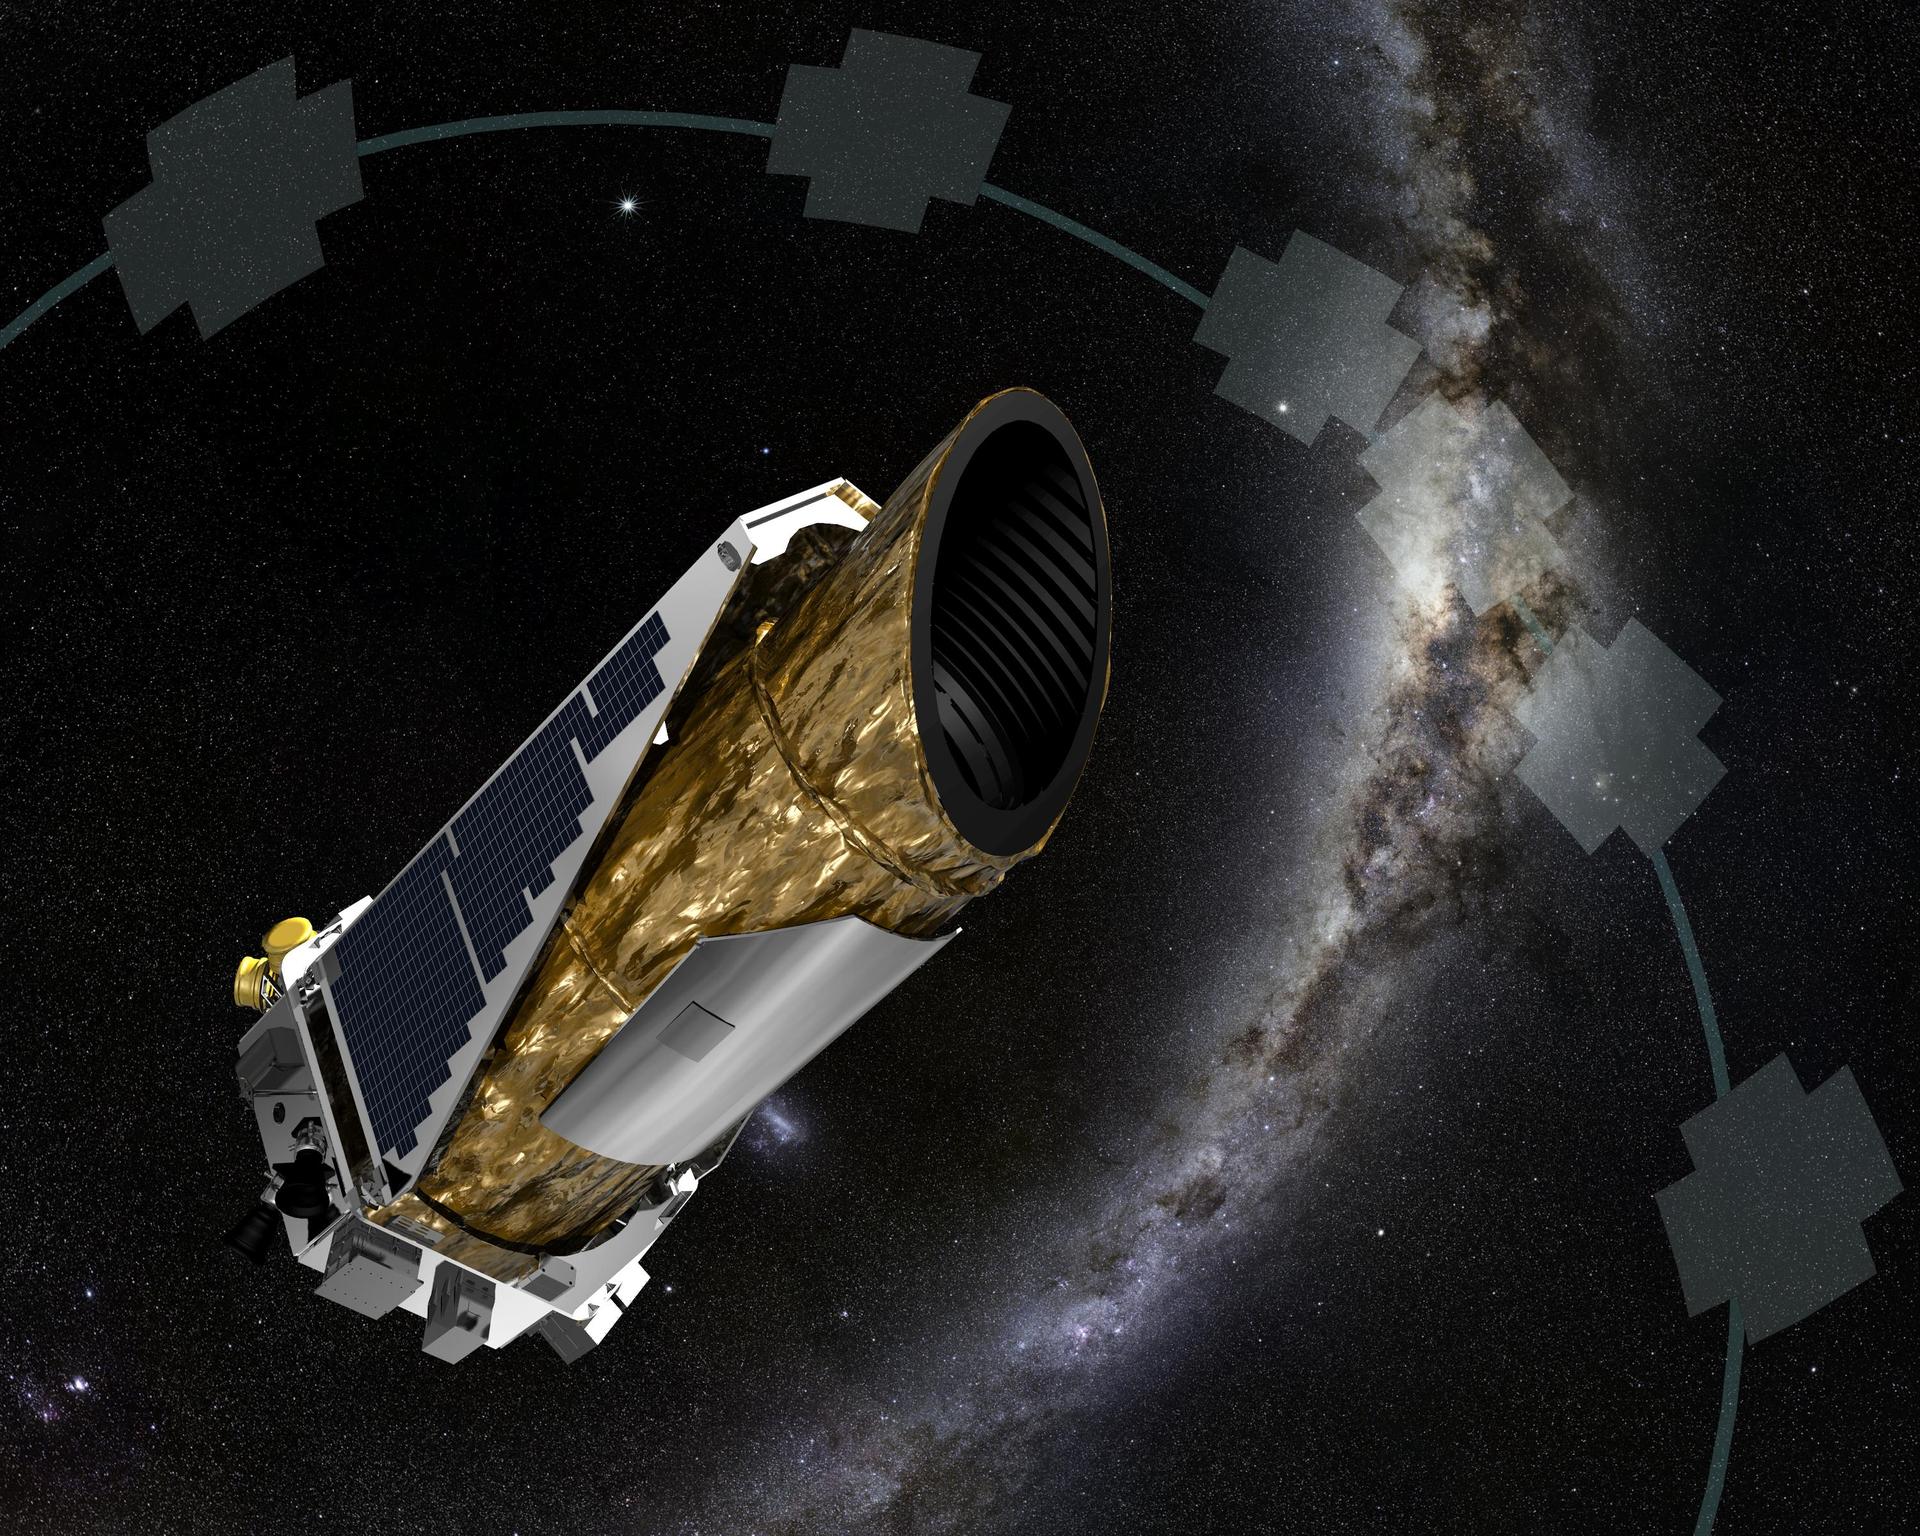
Long-baseline light curves make Kepler uniquely valuable for shadow imaging, long-term variability, missing transits, and structured dimming that evolves over many orbital cycles.
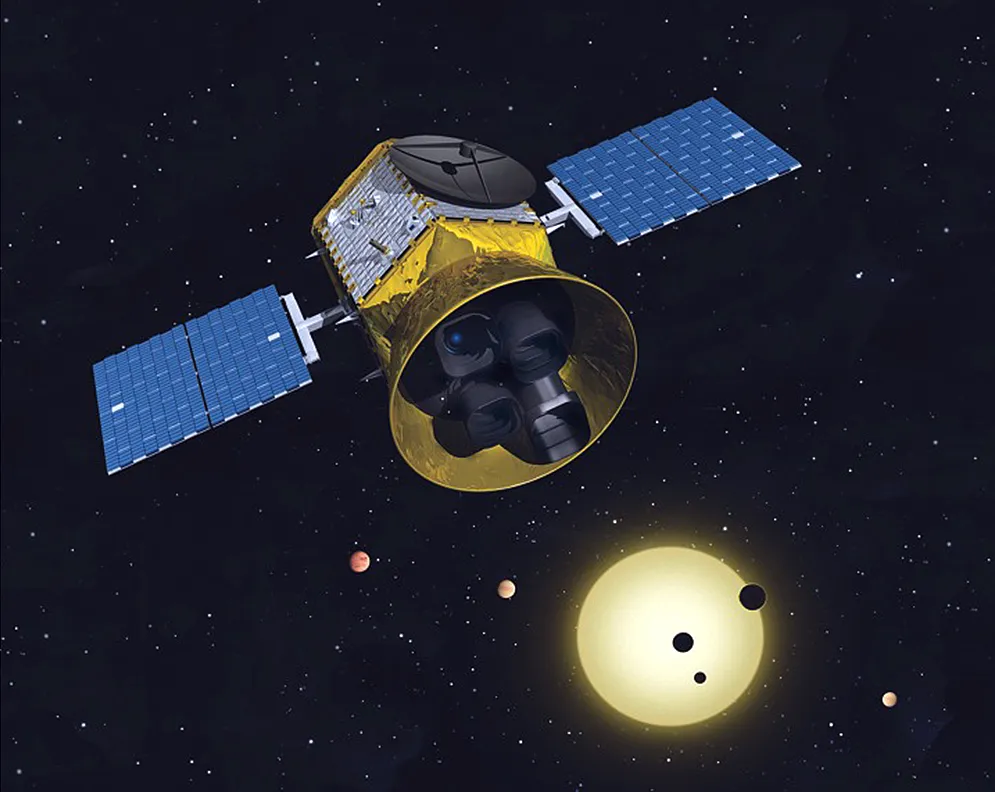
All-sky monitoring of bright nearby stars supports searches for anomalous light curves, single odd transit events, asymmetric dips, and rare one-off occultations.
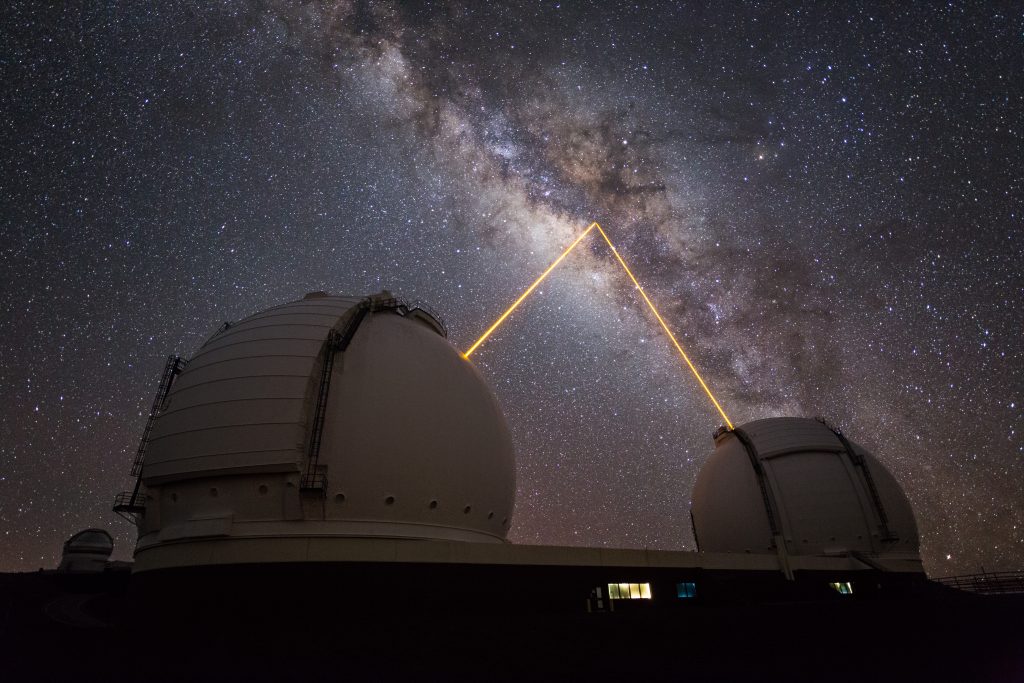
Decades of high-resolution stellar spectra are well suited to narrow laser-like emission searches, repeatability checks, and nearby-star technosignature constraints.
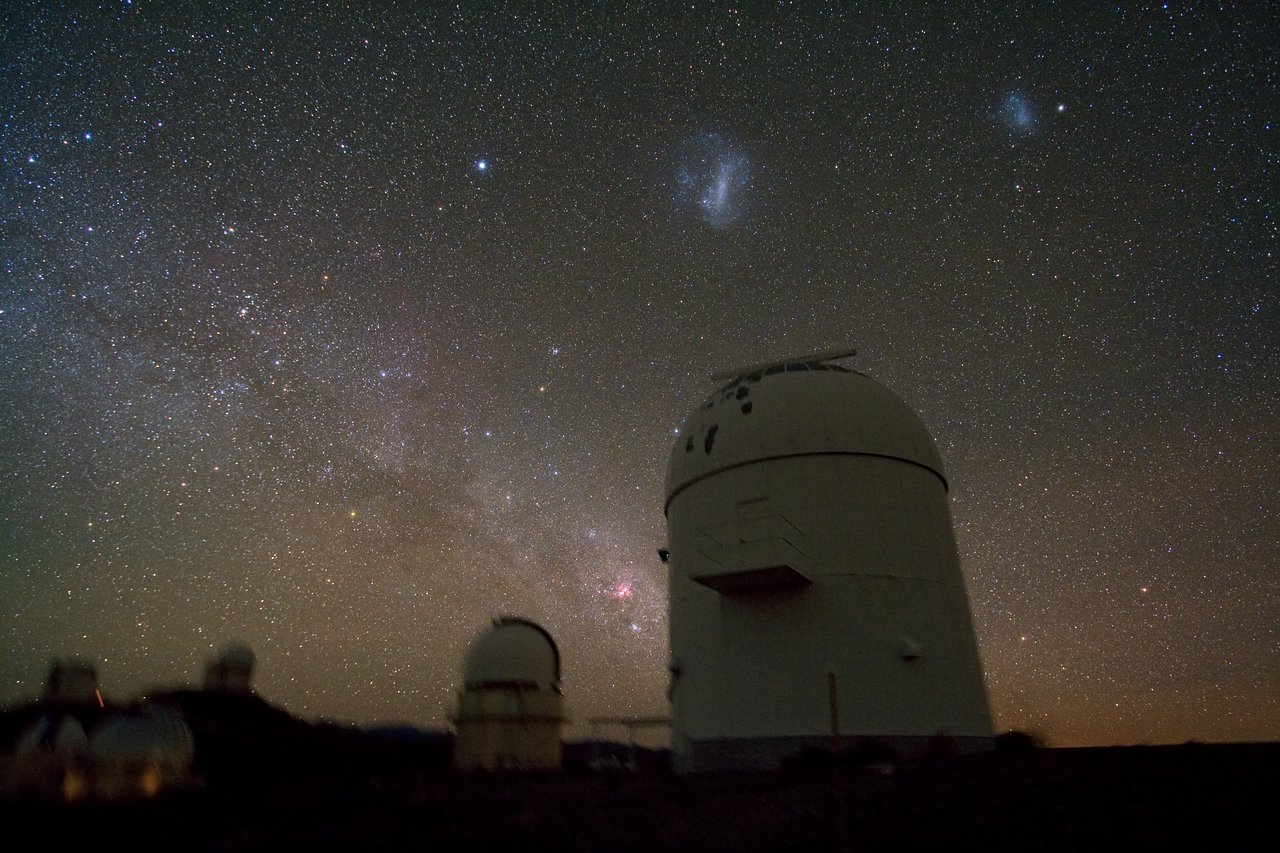
Ultra-stable radial-velocity spectra can be re-mined for unresolved emission spikes, repeated narrow-line events, and spectral artifacts that survive telluric and instrumental vetoes.
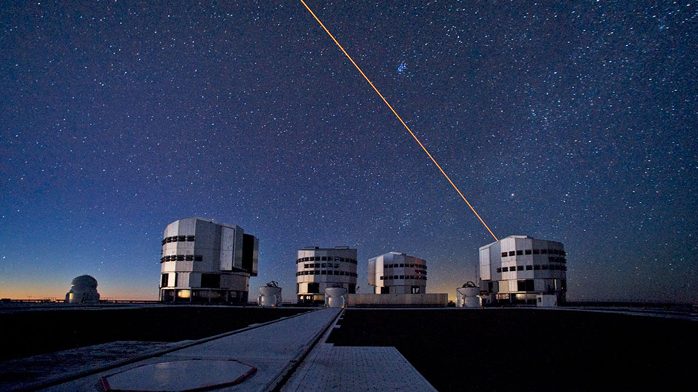
Exceptional resolving power and instrumental stability make ESPRESSO a priority archive for laser-line sensitivity estimates and rigorous false-positive rejection.
Flagship pipeline
MegaMiner is an AI-driven automated algorithm that uses ExoMiner as its main kernel, together with custom-built anomaly-detection tools, to identify sky-localized repeated transit events that exhibit unusual shapes.
Approximately 1 million threshold crossing events from folded TESS light curves.
TESS TCEs, quality masks, sector stitching, and catalogue matching.
Planet, astrophysical false-positive, and instrumental-artifact scores, plus ExoMiner-derived anomaly Z-scores for odd transit shapes.
A specially designed conditional autoencoder removes eclipsing binaries and other recurrent astrophysical contaminants.
LLM-based searches of existing literature and catalogues, followed by LLM-assisted vetting of the TESS DV report.
A ranked list of sky-localized, repeated, shape-anomalous transit events with archive provenance, ExoMiner context, autoencoder anomaly filtering, literature status, and DV-report evidence ready for human review.
Spectral mining map
The search does not stop at published velocities. It asks whether the original high-resolution spectra contain narrow, emission-like features that survive checks against stellar physics, tellurics, cosmic rays, sky lines, and instrument behavior.